Each underlying Private Equity fund commitment or direct co-investment made by VPEG5 will be valued on a monthly basis in accordance with the International Private Equity Investment Valuation Guidelines, endorsed by the Australian Investment Council (AIC). As a result, each underlying private equity investment held by each VPEG5 entity is valued monthly, with individual company investments valued on a multiple of earnings basis, with all valuations independently audited at least annually and often more frequently. VPEG5’s monthly valuations therefore represent a transparent summary of the performance of its underlying portfolio.
VANTAGE PRIVATE EQUITY GROWTH 5 – Monthly Valuations
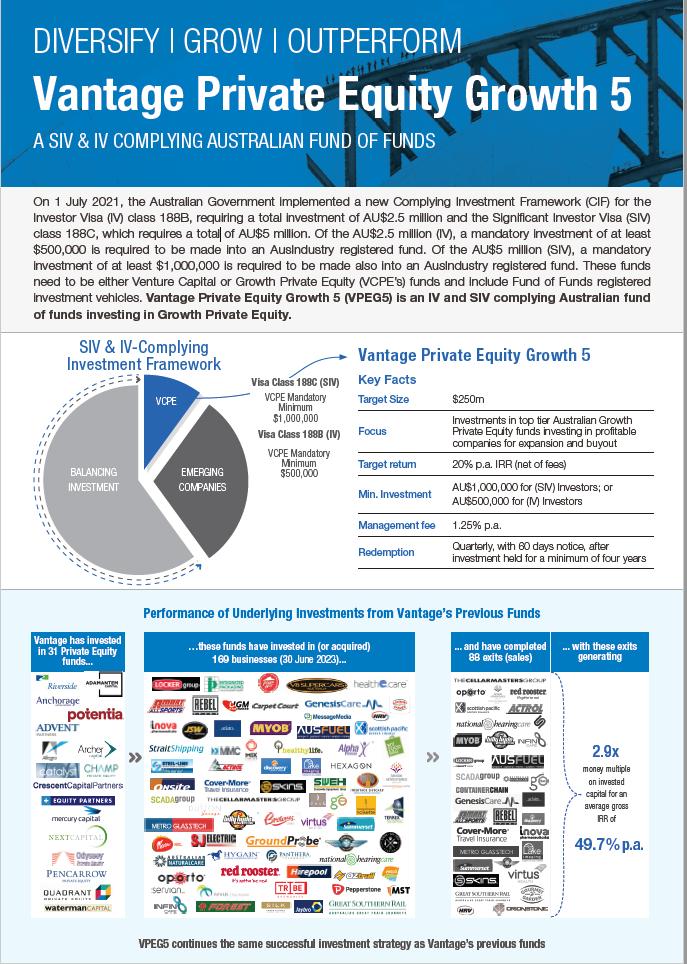
Over time and during the term of the Fund, Capital Calls will be made by Vantage to each Investor with the Called Funds applied towards meeting the call payment obligations for each Underlying Private Equity Investment of the Fund, or to meet working capital requirements of the Fund. As each Capital Call is paid by an Investor, or drawn from the cash management trust, to the Fund, the Paid Capital of each Investor increases such that the Paid Capital is equal to the aggregate of Called Capital less any distributions paid by the Fund to Investors.
Consolidated VPEG5 Net Asset Value – Monthly Valuation
| Month Ending | Cash | Fixed Interest Investments | Private Equity (Value) | Paid Capital / $ of Committed Capital to VPEG5 | NAV / $ of Committed Capital |
| 29-Feb-2024 | 0.4% | 29.2% | 70.4% | 0.39 | 0.345 |
| 31-Jan-2024 | 7.7% | 25.3% | 67.0% | 0.39 | 0.346 |
| 31-Dec-2023 | 0.3% | 26.5% | 73.2% | 0.39 | 0.346 |
| 30-Nov-2023 | 4.8% | 0.3% | 94.9% | 0.29 | 0.220 |
| 31-Oct-2023 | 3.7% | 15.9% | 80.4% | 0.29 | 0.221 |
| 30-Sep-2023 | 0.4% | 28.7% | 70.9% | 0.29 | 0.222 |
| 31-Aug-2023 | 6.9% | 28.4% | 64.7% | 0.29 | 0.220 |
| 31-Jul-2023 | 1.3% | 19.9% | 78.7% | 0.20 | 0.133 |
| 30-June-2023* | 2.3% | 28.7% | 69.0% | 0.20 | 0.134 |
| 31-May-2023 | 4.9% | 19.6% | 75.5% | 0.20 | 0.143 |
| 30-Apr-2023 | 9.4% | 15.7% | 74.9% | 0.20 | 0.144 |
| 31-Mar-2023 | 9.2% | 15.0% | 75.8% | 0.20 | 0.148 |
| 28-Feb-2023 | 11.0% | 17.0% | 72.0% | 0.20 | 0.159 |
| 31-Jan-2023 | 7.9% | 35.6% | 56.5% | 0.20 | 0.170 |
| 31-Dec-2022 | 36.8% | 4.5% | 58.7% | 0.20 | 0.171 |
| 30-Nov-2022 | 31.2% | 4.9% | 63.9% | 0.20 | 0.165 |
| 31-Oct-2022 | 24.7% | 5.9% | 69.3% | 0.20 | 0.165 |
| 30-Sep-2022 | 4.2% | 26.8% | 68.9% | 0.15 | 0.132 |
| 31-Aug-2022 | 11.8% | 29.1% | 59.1% | 0.15 | 0.139 |
| 31-Jul-2022 | 17.5% | 36.7% | 45.8% | 0.15 | 0.140 |
| 30-Jun-2022 | 50.0% | 0.6% | 49.4% | 0.15 | 0.129 |
| 31-May-2022 | 87.43% | 10.1% | 2.43% | 0.15 | 0.118 |
| 30-Apr-2022 | 50.4% | 39.8% | 9.9% | 0.05 | 0.020 |
| 31-Mar-2022 | 87.2% | 12.8% | 0.0% | 0.05 | 0.025 |
| 28-Feb-2022 | 24.9% | 73.9% | 1.1% | 0.05 | 0.026 |
| 31-Jan-2022 | 100.0% | 0.0% | 0.0% | 0.05 | 0.029 |
*Unaudited and before end of year distribution (if any), payable in October 2023
VPEG5, LP Net Asset Value – Monthly Valuation
| Month Ending | Cash | Fixed Interest Investments | Private Equity (Value) | Paid Capital / $ of Committed Capital to VPEG5 | NAV / $ of Committed Capital |
| 29-Feb-2024 | 0.3% | 33.5% | 66.2% | 0.26 | 0.182 |
| 31-Jan-2024 | 9.0% | 26.8% | 64.2% | 0.26 | 0.183 |
| 31-Dec-2023 | 0.4% | 31.3% | 68.3% | 0.26 | 0.178 |
| 30-Nov-2023 | 6.8% | 0.2% | 93.1% | 0.18 | 0.090 |
| 31-Oct-2023 | 4.2% | 10.1% | 85.8% | 0.18 | 0.090 |
| 30-Sep-2023 | 0.4% | 34.9% | 64.7% | 0.18 | 0.091 |
| 31-Aug-2023 | 6.7% | 36.1% | 57.2% | 0.18 | 0.094 |
| 31-Jul-2023 | 0.6% | 27.6% | 71.8% | 0.15 | 0.068 |
| 30-June-2023* | 3.0% | 39.9% | 57.1% | 0.15 | 0.070 |
| 31-May-2023 | 6.0% | 25.6% | 68.4% | 0.15 | 0.083 |
| 30-Apr-2023 | 4.7% | 22.3% | 73.0% | 0.15 | 0.083 |
| 31-Mar-2023 | 2.0% | 20.4% | 77.6% | 0.15 | 0.087 |
| 28-Feb-2023 | 5.5% | 23.1% | 71.3% | 0.15 | 0.100 |
| 31-Jan-2023 | 1.6% | 50.0% | 48.5% | 0.15 | 0.110 |
| 31-Dec-2022 | 44.4% | 4.6% | 51.0% | 0.15 | 0.110 |
| 30-Nov-2022 | 39.2% | 4.8% | 56.0% | 0.15 | 0.113 |
| 31-Oct-2022 | 32.3% | 6.2% | 61.4% | 0.15 | 0.113 |
| 30-Sep-2022 | 6.8% | 6.0% | 57.3% | 0.10 | 0.070 |
| 31-Aug-2022 | 18.9% | 21.4% | 59.6% | 0.10 | 0.073 |
| 31-Jul-2022 | 17.5% | 36.7% | 45.8% | 0.10 | 0.076 |
| 30-Jun-2022 | 50.0% | 0.6% | 49.4% | 0.10 | 0.068 |
| 31-May-2022 | 87.4% | 10.1% | 2.5% | 0.10 | 0.071 |
| 30-Apr-2022 | 50.4% | 39.8% | 9.9% | 0.05 | 0.020 |
| 31-Mar-2022 | 87.2% | 12.8% | 0.0% | 0.05 | 0.025 |
| 28-Feb-2022 | 24.9% | 73.9% | 1.1% | 0.05 | 0.026 |
| 31-Jan-2022 | 100.0% | 0.0% | 0.0% | 0.05 | 0.029 |
*Unaudited and before end of year distribution (if any), payable in October 2023
VPEG5A Net Asset Value – Monthly Valuation
| Month Ending | Cash | Fixed Interest Investments | Private Equity (Value) | Paid Capital / $ of Committed Capital | NAV / $ of Committed Capital |
| 29-Feb-2024 | 0.4% | 23.6% | 76.0% | 0.13 | 0.163 |
| 31-Jan-2024 | 6.0% | 23.3% | 70.7% | 0.13 | 0.163 |
| 31-Dec-2023 | 0.2% | 20.2% | 79.6% | 0.13 | 0.168 |
| 30-Nov-2023 | 3.1% | 0.4% | 96.5% | 0.11 | 0.130 |
| 31-Oct-2023 | 3.2% | 22.0% | 74.8% | 0.11 | 0.131 |
| 30-Sep-2023 | 0.4% | 22.3% | 77.2% | 0.11 | 0.131 |
| 31-Aug-2023 | 7.2% | 16.7% | 76.2% | 0.11 | 0.126 |
| 31-Jul-2023 | 2.6% | 7.1% | 90.3% | 0.05 | 0.065 |
| 30-June-2023* | 1.2% | 10.2% | 88.7% | 0.05 | 0.064 |
| 31-May-2023 | 2.6% | 7.0% | 90.4% | 0.05 | 0.060 |
| 30-Apr-2023 | 17.8% | 3.9% | 78.2% | 0.05 | 0.061 |
| 31-Mar-2023 | 23.7% | 4.0% | 72.3% | 0.05 | 0.061 |
| 28-Feb-2023 | 22.5% | 4.2% | 73.4% | 0.05 | 0.060 |
| 31-Jan-2023 | 21.8% | 4.2% | 74.0% | 0.05 | 0.060 |
| 31-Dec-2022 | 20.6% | 4.2% | 75.2% | 0.05 | 0.061 |
| 30-Nov-2022 | 12.3% | 5.0% | 83.1% | 0.05 | 0.054 |
| 31-Oct-2022 | 7.1% | 5.3% | 87.6% | 0.05 | 0.053 |
| 30-Sep-2022 | 1.4% | 16.5% | 82.1% | 0.05 | 0.062 |
| 31-Aug-2022 | 18.9% | 21.4% | 59.6% | 0.05 | 0.066 |
| 31-Jul-2022 | 0.0% | 0.0% | 0.0% | 0.05 | 0.064 |
| 30-Jun-2022 | 0.0% | 0.0% | 0.0% | 0.05 | 0.061 |
| 31-May-2022 | 0.0% | 0.0% | 0.0% | 0.05 | 0.047 |
*Unaudited and before end of year distribution (if any), payable in October 2023